Spokane Valley Cycling

Wednesday, March 11, 2015

Debris Flows and the 2009 Station Fire near Los Angeles, California


          Wildfires can result in mass-wasting events in subsequent years. Through the removal of vegetation, slope stability can be compromised. Without vegetation on slopes, increased run-off can also be a contributing factor in the failure and movement of a slope. Furthermore, the inclusion of debris on a slope after a wildfire can add more material that may pose detrimental hazards. Of course, landslides can disrupt ecosystems downslope; yet, landslides can also have negative impacts on humans and human structures downslope from the slide. The threat to humans and human structures will be the focus of this paper. Specifically, the areas affected by the 2009 Station Fire in Los Angeles County, California will be examined to elucidate the possibility of a mass-wasting event affecting the area immediately downslope from the location of the Station fire, near Los Angeles, California.

          As cited in a USGS report, “the area is frequently subject to brief torrential storms that result in floods of exceptionally high intensity” (Cannon et. al). These high intensity downpours can pose a significant problem to a slope that has recently been scarred by a fire. Two leading causes of debris flows are surface erosion caused by increased run-off, and soil saturation caused by prolonged rainfall. The most common of cause of slope failure is slope erosion caused by increased run-off (USGS). The frequent high intensity storm events in the San Gabriel Mountains coupled with the damage left by the Station fire in 2009 suggest this area is prone to mass-wasting events.

          Debris flows in the San Gabriel Mountains are not uncommon events. As a result of the precarious nature of slopes and prevalence of wildfires in Southern California, this area has endured numerous flows throughout recent history. For instance:

          On January 22, 1969 debris flows generated from basins burned the previous summer along the           San Gabriel mountain front east of the La Crescenta–Montrose event enveloped buildings,                   poured through doors and windows, and surrounded the automobiles of the residents
          attempting to flee the disaster (Cannon et. al)

          Debris flow models produced by the United States Geological Survey following the 2009 Station fire predict that the slopes – in particular the steeper slopes - affected by the fire are more likely to undergo a failure. As expected, more intense rainfall events resulted in a higher likelihood of a debris- flow (Cannon et. al). Although this fire occurred recently, most of the debris flows associated with a fire happens within the two subsequent years (USGS). In the two years following a fire, vegetation has a chance to reestablish and add stability to a slope. Consequently, any current debris flows may not necessarily be attributed to the 2009 Station fire.

          In summary, a positive correlation between debris-flows and wildfires undoubtedly exist. Through stripping a slope of vegetation, wildfires can decrease slope stability and increase run-off. Increased run-off can result in increased erosion of a slope. Erosion of a slope as a result of run-off is the leading cause of debris flows. As previously noted, the area affected by the 2009 station fire commonly endures intense rainfall which can increase the likelihood of a debris flow. Yet, any current debris flows are not likely associated with the 2009 station fire.


Works Cited
Cannon, S.H., Gartner, J.E., Rupert, M.G., Michael, J.A., Staley, D.M., and Worstell, B.B., 2010,
          Emergency assessment of postfire debris-flow hazards for the 2009 Station fire, San Gabriel
          Mountains, southern California: U.S. Geological Survey Open–File Report 2009-1227, 27 p.
          (Revised April 2010)

United States Geological Survey. Southern California- Wildfires and Debris Flows. n.p. Web. 10
          March 2015.

Friday, February 20, 2015

Black-Footed Ferret


View larger map


Black-Footed Ferret

The black-footed ferret once thrived in the central United States – with a population in excess of ten-thousand. The black-footed ferret inhabited the great basin, ranging from Arizona to Montana, with semi-arid grasslands and mountain basins being their primary habitat. As human populations increased, the pressures exerted on the black-footed ferret resulted in significant population reduction. Deemed agricultural pests, black-footed ferret eradication programs were emplaced to exterminate these organisms. Eradication programs were so successful that in 1987 only eighteen ferrets existed in the world. However, conservation efforts have helped re-establish these mammals that were once thought to be extinct.
The extent of cropland in the United States is illustrated in one of the map layers provided. As can be noticed on the map, black-footed ferret populations coincide with agricultural lands. Partly the result of the destruction of habitat and the conversion to cropland, these animals faced a loss of adequate habitat and their numbers further suffered. As previously noted, the black-footed ferret was viewed as a pest and eradication programs were created to rid agriculture areas of this animal. However, this animal was not the only agriculture pest that was persecuted in the Great Plains. Prairie dogs also faced extermination efforts. As the primary prey for the black-footed ferret, the loss of prairie dogs provided more detriments to the ferret.  Furthermore, foreign diseases, affecting populations placed further stress on the black-footed ferret.
The black-footed ferret has been listed on the endangered species list since 1967. Despite the near extinction of the species, conservation efforts in recent years have improved the species’ outlook. Reintroduction of the species began in 1991; currently, all of the wild ferret populations consist of introduced animals. Recent estimates place the total number of wild breeding ferrets somewhere between five-hundred and one-thousand – a vast difference from only eighteen animals in 1987. Since 1991, there have been eighteen reintroduction efforts. Yet, only three of these have yielded self-sustaining populations. Despite the low number of self-sustaining populations, this current trend suggests the black-footed ferret may be removed from the endangered species in coming years.

 
Works Cited
"Endangered Species: Mountain-Prairie Region: U.S. Fish and Wildlife Service." Endangered Species:   Mountain-Prairie Region: U.S. Fish and Wildlife Service. N.p., n.d. Web. 18 Feb. 2015.

"Mustela Nigripes." (Black-footed Ferret). N.p., n.d. Web. 19 Feb. 2015.


Monday, February 9, 2015

Cape Disappointment - DEM

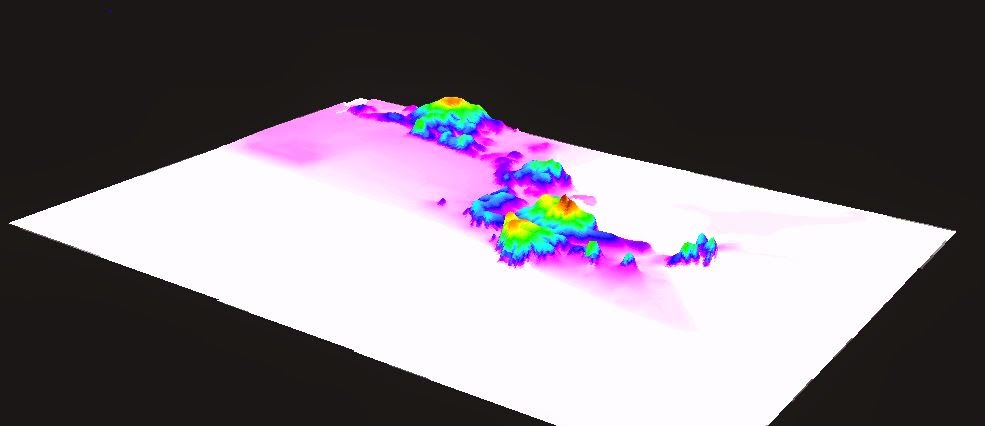
The area used for this lab is focused around Cape Disappointment off of the coast of southwest Washington. The extent of this map is 46.07 N Lat to 46.19 N Lat and 123.779 W Long to 123.69 W Long. The geographic coordinate system is NAD_1927_UTM_Zone_10N.


Tuesday, January 27, 2015

Advantages and Disadvantages of Map Projections

Different map projections can have certain benefits and disadvantages. Three types of map projections were represented in the current assignment – equal area, equidistant and conformal. As the name suggests, equal area maps preserve areas of features. To preserve areas, “other properties—shape, angle, and scale—are distorted” (arcgis.com). Equidistant maps preserve the distances between different points. The drawback of equidistant maps is that scale cannot be preserved throughout the entire map. Lastly, conformal map projections are designed to preserve a local shape. As described on arcgis.com, “To preserve individual angles describing the spatial relationships, a conformal projection must show the perpendicular graticule lines intersecting at 90-degree angles on the map. A map projection accomplishes this by maintaining all angles. The drawback is that the area enclosed by a series of arcs may be greatly distorted in the process.”
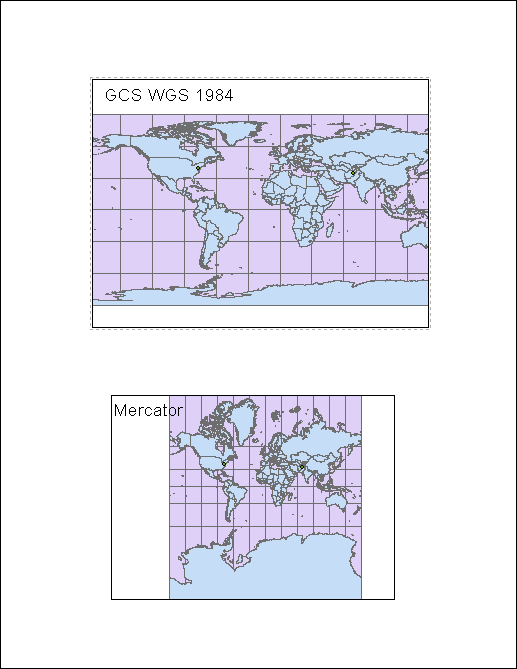
Experimenting with various map projections in ArcMap made the benefits and disadvantages of map projections readily apparent. To project a three dimensional object – namely Earth – onto a two dimensional medium certain distortions must take place. Different projections are designed to mitigate particular distortions. Yet, the mitigation of a particular distortion results in the exacerbation of another distortion. For example, the Mercator projection is designed for little distortion of shape near the equator. To provide the lower distortions near the equator, greater distortions are evident near the poles. This can be recognized on a Mercator projection of the globe. Antarctica appears to be much larger than it is in actuality.
The distortions that arise with map projection are inevitable. As previously noted certain distortions can be exacerbated in map projections. Conversely, certain distortions are lessened for a variety of purposes. For instance the equidistant conic projection defines two standard parallels that feature no distortion. If areas along these parallels were of interest, this type of map projection would be suitable. This is just one example of the mitigation of distortions. The complete description of distortions is not the intent of this paper.
Evidently, no one map can be described as the greatest overall. Certain projections work best for certain situations. The numerous types of map projections each represent a set of distortions – some of which are great and others that are lessened. The six projections illustrate in the previous example provide additional insight into map distortions. The six projections provided early are: GCS WGS 1984, Mercator, Equidistant Conical, Equidistant Cylindrical, Berhmann, and Cylindrical Equal Area.


Works Cited
"ArcGIS Help 10.1." ArcGIS Help 10.1. N.p., n.d. Web. 27 Jan. 2015.


Map Projections


This post features six different map projections that illustrate variability in map projections.


GCS WGS 1984
Distance between Washington, DC and Kabul, Afghanistan
·         Geodesic – 100.36 Decimal Degrees
·         Loxodrome – 117.4 Decimal Degrees
·         Great Elliptic – 100.4 Decimal Degrees
The Geodesic and Great Elliptic measurements feature lines with an arc, while the loxodrome measurement features a straight line.

Mercator
Distance between Washington, DC and Kabul, Afghanistan
·         Geodesic – 11,159,983 meters
·         Loxodrome – 13,055,122 meters
·         Great Elliptic – 11,159,992 meters

Equidistant Conic
Distance between Washington, DC and Kabul, Afghanistan
·         Geodesic – 11,159,983 meters
·         Loxodrome – 13,055,122 meters
·         Great Elliptic – 11,159,992 meters

Equidistant Cylindrical
Distance between Washington, DC and Kabul, Afghanistan
·         Geodesic - 11,159,983 meters
·         Loxodrome – 13,055,122 meters
·         Great Elliptic – 11,159,992 meters

Behrmann
Distance between Washington, DC and Kabul, Afghanistan
·         Geodesic - 11,159,983 meters
·         Loxodrome – 13,055,122 meters
·         Great Elliptic –  11,159,992 meters

 Cylindrical Equal Area
Distance between Washington, DC and Kabul, Afghanistan
·         Geodesic – 11,159,983 meters
·         Loxodrome – 13,055,122 meters
·         Great Elliptic – 11,159,992 meters


Monday, January 26, 2015

My Initial ArcMap Experience

          My initial experience with Arc Map was in a word, frustrating. The program’s user interface was somewhat unintuitive. Seemingly, it takes substantial practice with the program to become a proficient user. The layout of the program is sensible, but various commands and features of the program are unintelligible and can be disconcerting when trying to use. For example, the Select tool in the ArcMap program seems to only select items under certain conditions. Although I may have been making a mistake in the use of the tool, one would assume that the point and click technique would be all that was required.

          Additionally, another frustrating aspect of ArcMap was the addition of text onto a layout. Editing text in a text box cannot be done with a simple click in the text box to produce a cursor, as is common in various software programs. To edit certain text boxes in ArcMap, a user needs to double click on a box or right click to edit it. Another part of ArcMap I found bothersome was the lag of the program. Every time I use the program, the software lags regardless of the computer. Surely, others have voiced similar concerns and dislikes about the ArcMap program.

         Despite my negative opinions of ArcMap, I recognize that this program is a very useful and powerful geographic tool. This short tutorial over ArcMap elucidated several applications for GIS and the benefits that GIS provides. For instance, the use of GIS to plot population densities as well as various physical features would be very useful in land management or city planning. Also, GIS would be useful in the construction industry. ArcMap and other similar programs could be used to display the geographic extent of a construction site. Of course, these are just a couple of the numerous applications of ArcMap. By the use of a skilled professional, ArcMap has the potential to be a powerful geographic tool.

         Certain negative aspects may arise from the use of ArcMap. If the user does not have adequate training, a substandard work may be produced. Although substandard can have an array of meanings in this context, some may be more serious than others. For instance, incorrect font size or text placement will hardly cause any affairs. Yet, the incorrect placement of parcel lines has the potential to result in serious negative consequences. Surely, the positive consequences of GIS outweigh the negative consequences of GIS.